
TL;DR
- Waist circumference is a useful clue about abdominal fat and metabolic risk, but a tape measure cannot diagnose diabetes, heart disease, or metabolic syndrome by itself.1
- A sound reading depends on method: measure at the same anatomical point, keep the tape level and snug, relax, and take the number after a normal breath out.2
- “Asian” is not one body type or one risk profile, so a threshold derived in Japan, China, or Sri Lanka should not be presented as a Filipino diagnosis.3
- Published cutoffs are practical action points shaped by the population, outcome, and statistical method; risk changes across a range instead of starting at one magic centimetre.4
For Filipino readers, waist circumference can seem refreshingly simple: one tape, one number, one answer. The research is less tidy, and more useful, than that. Waist size can add information that body weight alone misses.1 Yet the reading changes with technique, and its meaning changes with population and purpose.5 The right question is not “Am I safe?” but “What does this measurement add to the larger picture?”6
What the tape can—and cannot—show
Waist circumference is a rough marker of abdominal fat, the fat carried around the middle.1 It does not directly scan the organs or measure the exact amount of deeper visceral fat.1 Its value comes from an observed link: larger waist measurements tend to travel with higher metabolic and cardiovascular risk across populations.1
That makes the number a signal, not a verdict.6 A person can sit below a published cutoff and still have other risk factors.4 Another person can cross it without receiving a diagnosis from the tape alone.6 Blood pressure, blood glucose, blood lipids, family history, age, and clinical context answer questions a circumference cannot.6
The kindest and most accurate use is practical.4 Read the number as one prompt for a fuller health conversation, never as a grade for discipline, beauty, or worth.6
For readers looking for the exact topic, the tirzepatide card below shows its live catalog details.
Make the measurement repeatable
WHO places the tape midway between the lower edge of the last rib you can feel and the top of the hip bone.2 The tape should stay level, fit snugly, and avoid pressing into the skin.2 The person stands upright with weight shared across both feet and arms resting by the sides.2
Relax the abdomen and take the reading after a normal breath out.2 Pulling the stomach inward can reduce the number, while posture, clothing, food, and breathing can shift it.7 A stretch-resistant tape is better than one that lengthens under tension.2
WHO advises two readings.7 Average them if they are within 1 cm; if they differ by more, repeat both.7 For a trend, keep the site and method consistent.7 A small change made with different technique may describe the measuring process more than the body.7
BMI and waist answer different questions
BMI relates weight to height, while waist circumference adds information about where body mass is carried.8 Neither measure sees body composition directly, and neither tells a complete health story.1 Used together, they can frame different parts of the same risk discussion.6
This matters for Asian readers because risk does not always line up neatly with the standard BMI boundary.8 A WHO expert consultation found substantial diabetes and cardiovascular risk in Asian populations below a BMI of 25.8 It also declined to set one new BMI cutoff for every Asian population because observed risk ranges differed.8
Waist measurement does not solve that variation with one universal number.5 WHO likewise found that disease risk at a given waist value can vary by population.5 The useful move is to keep both the number and its source population in view.3
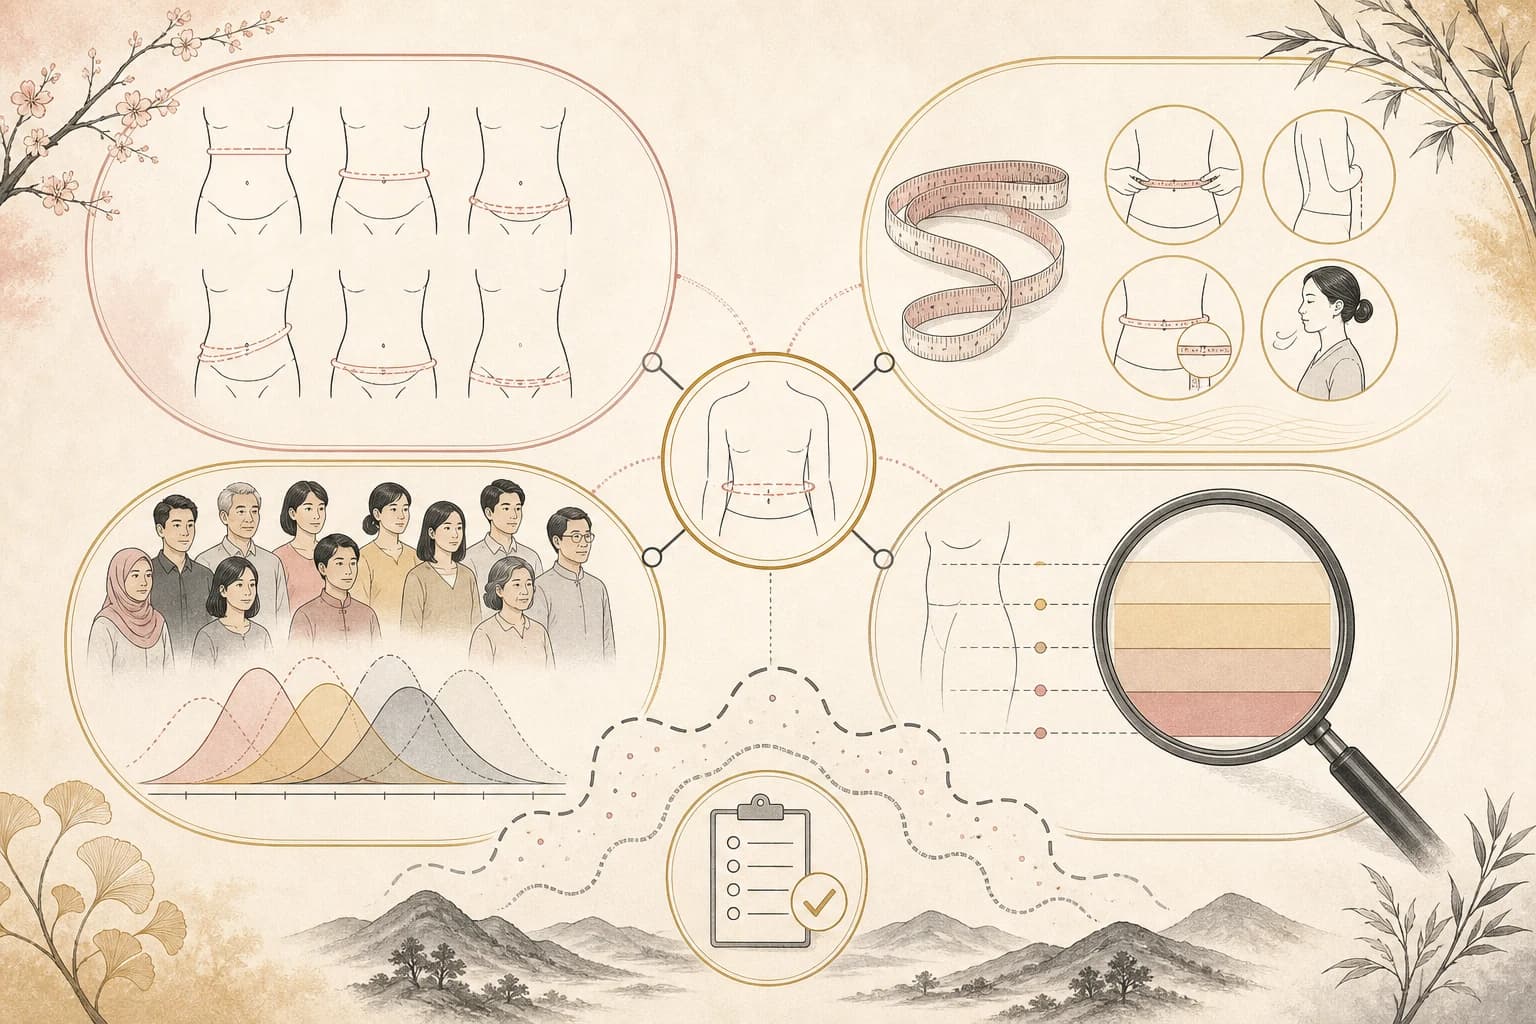
“Asian” is a map, not one data point
Research labels can hide diversity.3 WHO notes that Chinese, Japanese, Korean, and South Asian groups are often combined under “Asian,” even though their body-composition patterns are not identical.3 Filipino readers should therefore resist borrowing any neighboring population’s threshold as an automatic local rule.3
One widely quoted table in the WHO report reproduces International Diabetes Federation values above 90 cm for men and above 80 cm for women in South Asian, Chinese, and Japanese groups.9 That table does not validate the same pair as a Filipino cutoff.9 It also does not turn 89.9 cm into safety or 90.1 cm into disease.4
A threshold is a decision tool built for a stated purpose.4 It may help a program decide who receives added screening, but it cannot capture every person’s blood pressure, glucose, lipids, age, or family history.6
Why two good studies can give different cutoffs
The Hisayama study followed 2,452 Japanese adults aged 40 or older for 14 years.10 For cardiovascular-event prediction in that community, the researchers suggested 90 cm for men and 80 cm for women.10 The study recorded 246 first cardiovascular events, making the result prospective rather than a one-time snapshot.10
Another Japanese study followed 54,980 workers without diabetes at baseline for up to six years.11 For incident diabetes, its analysis suggested 85 cm for men and 80 cm for women.11 The men’s values differ even though both studies were conducted in Japan.10
The difference is not a mistake to average away.4 One study focused on an older community and cardiovascular events; the other focused on workers and new diabetes.11 Population, outcome, follow-up, and statistical method all help define a cutoff.5
For readers looking for the exact topic, the semaglutide card below shows its live catalog details.
Ratios offer another angle
Waist-to-height ratio divides waist circumference by height, while waist-to-hip ratio compares the waist with the hips.12 These ratios try to place the waist in relation to body size rather than reading centimetres alone.12 They remain screening measures, not diagnoses.6
In a cross-sectional analysis of 244,266 Chinese adults, waist-to-height ratio separated the studied cardiovascular risk factors better than waist circumference or BMI.13 The approximate waist cutoffs were 85 cm for men and 75 cm for women in that sample.13 Because the design was cross-sectional, it compared measurements and existing risk factors at one period rather than tracking future events.13
A cross-sectional study of 4,485 Sri Lankan adults also found that waist-to-height ratio separated several measured metabolic conditions better than the other body-size measures tested.12 That result belongs to its Sri Lankan sample and cannot become a Filipino rule by proximity.12
Read the trend without turning it into a score
A waist record becomes easier to interpret when the method stays stable.7 Use the same anatomical site, posture, tape tension, and breathing point each time.2 Two close readings are more useful than one hurried number.7
Then keep the trend in proportion.4 A cutoff does not create a sudden biological border, because metabolic risk changes along a continuum.4 Nor does a centimetre count explain why a change occurred.1 The tape supplies one observation; clinical measurements and personal history supply other parts of the picture.6
This approach also removes shame from the task.4 Bodies are not pass-or-fail projects, and population averages are not personal character tests.4 The careful reader asks three things: Was the waist measured consistently, which population and outcome produced the comparison, and what other health information belongs beside it?6
Bottom line
Waist circumference is useful because it adds a view of abdominal size that BMI alone does not provide.1 It works best as a repeatable screening signal, measured with a clear protocol and read beside other health information.6 For Asian readers, the label on the study matters: Japanese cardiovascular research, Japanese worker diabetes research, Chinese cross-sectional data, and Sri Lankan cross-sectional data answer different questions.3 Their cutoffs should not be blended into a homemade Filipino diagnosis.5
The calm reading is also the accurate one.4 Measure consistently, treat a threshold as an action point rather than a cliff, and keep the number separate from judgments about appearance or worth.4
This article is educational research context, not medical advice. Catalog links are neutral references and do not imply a treatment or human-use recommendation.
Frequently asked questions
Where exactly should I place the tape?
WHO places it midway between the lower edge of the last rib you can feel and the top of the hip bone.2 Keep it level and snug without pressing the skin.2 Stand relaxed, then read the tape at the end of a normal breath out.2
Should I measure at the navel?
Some research protocols use the navel or the top of the hip bone, while WHO uses the midpoint between the last palpable rib and hip crest.2 The sites can produce different numbers.7 Choose a defined method and keep it consistent when following a trend.7
Is 90 cm the Asian cutoff?
Not for every Asian population or every purpose.5 The WHO report reproduces a 90 cm value for men in several named Asian groups, but not as a validated Filipino rule.9 Japanese studies also produced different male cutoffs for different outcomes and populations.10
Can waist circumference diagnose metabolic syndrome?
No single waist reading can diagnose diabetes, cardiovascular disease, or metabolic syndrome.6 It can serve as a first-step risk signal.6 Interpretation may also include BMI, blood pressure, glucose, blood lipids, age, family history, and other clinical information.6
Is waist-to-height ratio better than waist circumference?
It performed better for the measured risk factors in large Chinese and Sri Lankan cross-sectional studies.13 That does not prove it predicts every future outcome or works identically in Filipinos.12 The best-supported reading keeps the design, population, and measured outcome attached to the ratio.12
What if my measurement sits just below a cutoff?
A value just below a threshold is not a guarantee of low risk.4 Risk changes across a continuum, while cutoffs simplify decisions for screening or public-health action.4 Other health information can matter on either side of the line, so the tape should not stand alone.6
Sources
Footnotes
-
Waist circumference and waist-hip ratio: report of a WHO expert consultation. WHO expert consultation reviewing measurement methods and relationships between anthropometric measures and health outcomes. An association or proxy measure is not a diagnosis and does not identify the exact location or amount of internal fat in an individual. ↩ ↩2 ↩3 ↩4 ↩5 ↩6 ↩7 ↩8
-
Waist circumference and waist-hip ratio: report of a WHO expert consultation. Standardized WHO waist-circumference measurement protocol. Other protocols use different anatomical sites, so readings should be compared only when the measurement method is known. ↩ ↩2 ↩3 ↩4 ↩5 ↩6 ↩7 ↩8 ↩9 ↩10 ↩11
-
Waist circumference and waist-hip ratio: report of a WHO expert consultation. WHO review of ethnic variation in body-fat distribution and anthropometric risk. Evidence from one Asian population should not be treated as a Filipino population estimate without local data. ↩ ↩2 ↩3 ↩4 ↩5 ↩6
-
Waist circumference and waist-hip ratio: report of a WHO expert consultation. WHO discussion of continuous risk, sensitivity, specificity and the policy uses of cutoffs. Risk also depends on factors not captured by waist circumference, and people on either side of a threshold may have different overall risk. ↩ ↩2 ↩3 ↩4 ↩5 ↩6 ↩7 ↩8 ↩9 ↩10 ↩11 ↩12 ↩13 ↩14
-
Waist circumference and waist-hip ratio: report of a WHO expert consultation. WHO expert review of population differences and cutoff selection. Existing thresholds can still serve as public-health action points when their source, population and intended use are stated. ↩ ↩2 ↩3 ↩4 ↩5 ↩6
-
Waist circumference and waist-hip ratio: report of a WHO expert consultation. WHO discussion of screening, diagnostic use and joint interpretation of anthropometric measures. A tape-measure result alone cannot diagnose diabetes, cardiovascular disease or metabolic syndrome. ↩ ↩2 ↩3 ↩4 ↩5 ↩6 ↩7 ↩8 ↩9 ↩10 ↩11 ↩12 ↩13 ↩14 ↩15
-
Waist circumference and waist-hip ratio: report of a WHO expert consultation. WHO guidance intended to reduce measurement variability. Food, breathing, posture, clothing, abdominal tension and the measurer can still affect a reading. ↩ ↩2 ↩3 ↩4 ↩5 ↩6 ↩7 ↩8 ↩9
-
Appropriate body-mass index for Asian populations and its implications for policy and intervention strategies.. WHO expert consultation on BMI, body fat and health risk across Asian populations. This is a population-level conclusion about BMI and does not define an individual diagnosis or a Filipino-specific cutoff. ↩ ↩2 ↩3 ↩4
-
Waist circumference and waist-hip ratio: report of a WHO expert consultation. WHO summary table of IDF ethnic or country-specific criteria. The table does not establish those values as validated Filipino cutoffs, and a cutoff is an action threshold rather than a biological cliff. ↩ ↩2 ↩3
-
Proposed criteria for metabolic syndrome in Japanese based on prospective evidence: the Hisayama study.. Community-based Japanese prospective cohort with 246 first cardiovascular events. The cutoffs were derived for cardiovascular prediction in an older Japanese community and are not a Filipino diagnostic rule. ↩ ↩2 ↩3 ↩4 ↩5
-
Optimal waist circumference cut-off points and ability of different metabolic syndrome criteria for predicting diabetes in Japanese men and women: Japan Epidemiology Collaboration on Occupational Health Study.. Japanese occupational cohort using time-dependent receiver operating characteristic analysis. A worker cohort, diabetes outcome and statistical cutoff method differ from the Hisayama cardiovascular study. ↩ ↩2 ↩3
-
Waist to height ratio: a better anthropometric marker of diabetes and cardio-metabolic risks in South Asian adults.. Nationally sampled Sri Lankan community study comparing anthropometric indices with measured metabolic variables. The design measured associations at one time and cannot prove future risk or supply a Filipino cutoff. ↩ ↩2 ↩3 ↩4 ↩5 ↩6
-
Optimal cut-off values of BMI, waist circumference and waist:height ratio for defining obesity in Chinese adults.. Measurements from seven Chinese health examination centers analyzed with receiver operating characteristic curves. Cross-sectional separation of existing risk factors cannot establish future outcomes, causation or Filipino-specific thresholds. ↩ ↩2 ↩3 ↩4