
TL;DR
- Percent weight change shows change relative to starting weight, while kilograms show the absolute change recorded on the scale in kilograms.1
- A group average cannot show everyone’s experience, so read it beside responder percentages and the study’s stated measurement time.2
- “Responder” is not a universal category; each study chooses its threshold, deadline, population, and analysis before readers compare published results.3
- Study completion and remaining on assigned treatment are different measures, and both help reveal whose outcomes shaped the final estimate.4
Filipino readers often meet one dramatic percentage in a headline or social post. Yet that number may be an average, a responder threshold, or a result among people still followed. Those are different ways to report one study.2 Reading the fine print changes what the headline can honestly mean.1 The denominator and deadline deserve equal attention.5
Start with the denominator
Percent weight change compares a person’s change with their baseline, or starting, weight.1 A 10-kilogram change therefore represents 10% for someone starting at 100 kilograms.1 It represents a smaller percentage for someone with a higher baseline.1 This makes percentages useful when a trial includes participants with different starting weights.1
The minus sign in “−10%” signals a reduction from baseline.6 Meanwhile, “percentage points” often describes the gap between two group percentages.6 These expressions answer different questions.6 One describes change within a group; the other compares groups.6 Always identify the baseline, endpoint, and unit before interpreting the number.1
That framing keeps comparisons readable.
Semaglutide is named here only to introduce the following neutral catalog reference.
An average is not a typical journey
A mean combines all measured changes into one group summary.2 It does not show whether most people clustered near that number or spread widely around it.2 Two trials can report the same mean while containing very different individual outcomes.2
Responder percentages add another view by counting who crossed a selected threshold.5 For example, a study may report how many participants reached at least 5%, 15%, or 20% by a stated week.5 Yet these categories still compress continuous changes into yes-or-no groups.5 Someone just below a line and someone far below it receive the same label.5
Read the mean and responder results together.2 The mean describes the group’s overall shift, while thresholds show how many crossed particular lines.5
Responder labels belong to their studies
Words such as “rapid,” “high,” or “minimal” responder can sound universal.3 They are not.3 A post hoc SURMOUNT-5 analysis defined rapid response as at least 15% reduction by week 24.7 A retrospective real-world study called at least 15% during year one a high response.3
The percentage was similar, but the deadlines and research designs differed.3 SURMOUNT-5 was a randomized phase III trial analysis.7 The other study reviewed electronic health records and matched treatment cohorts.8 Its outcome was the maximum recorded reduction over two years, not necessarily one fixed visit.8
Before comparing responder figures, ask four questions: What threshold was used? By when? In which population? Under which analysis?5 Without those details, identical labels can hide non-equivalent results.3
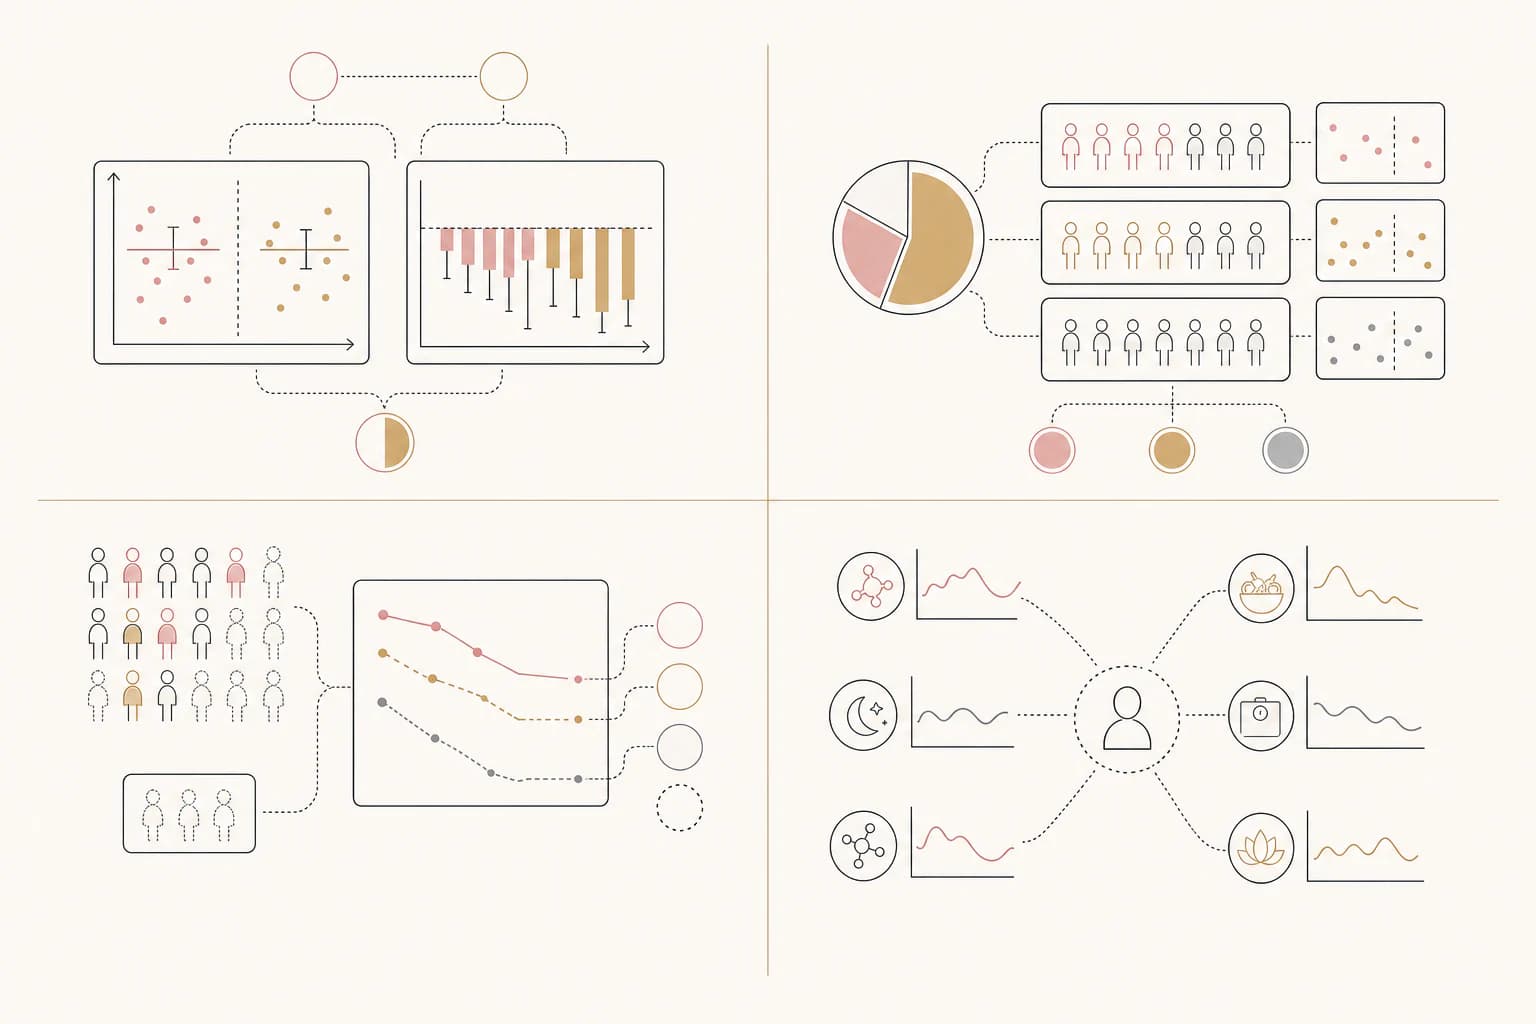
Trial examples show why context matters
In the SURMOUNT-5 post hoc analysis, 32.3% of participants met its rapid-response definition.7 The reported proportions were 44% with tirzepatide and 21% with semaglutide.7 These groups were created from outcomes after randomization, so they were not separately randomized groups.7
A Japanese-criteria subgroup from the same global trial reported mean changes at week 72.9 The estimates were −20.1% with tirzepatide and −12.9% with semaglutide.9 Those figures describe 383 participants who met specified Japanese obesity-disease criteria.9 They should not be assumed to represent every trial participant or Filipino readers.9
Another randomized trial, REDEFINE 1, studied adults without diabetes.6 At week 68, estimated mean change was −20.4% with cagrilintide-semaglutide and −3.0% with placebo.6 All groups also received lifestyle intervention.6
Dropouts are more than one number
“Dropout” can refer to leaving the study, stopping assigned treatment, or missing a later measurement. These states should not be treated as identical.4 REIMAGINE 2 makes the distinction visible.4 Among 2,713 randomized participants, 95.7% completed the 68-week study.4 However, 87.6% were still on assigned treatment at week 68.4
That gap matters because a participant can remain under study follow-up after stopping assigned treatment.4 Conversely, a later analysis may include only people with a recorded measurement at that point.10 Readers should look for the starting sample, the endpoint sample, and the reason each became smaller.11
A completion rate alone cannot explain how missing outcomes were handled.4 It also cannot show whether departures differed between comparison groups.4 These details affect how confidently a result describes everyone originally enrolled.11
Continuers can look different from starters
Real-world reports make follow-up especially important.11 A New York clinic study identified 294 people prescribed semaglutide during its study period.11 Only 163, or 55.4%, continued for at least 12 months.11 That continuing group averaged 8.1% total weight loss at 12 months.11
The result describes continuers, not all 294 people who started the observation window.11 If continuation relates to response or other patient factors, the average among continuers may not represent starters.11 This is selection bias, a limitation of who remains represented.11
A Chinese observational cohort reported 143 participants at week 12 and 113 at week 24.10 At week 24, the later group averaged 9.9% reduction, and 76.1% reached at least 5%.10 Its abstract did not explain every reason for the smaller later sample.10
Safety and response need careful separation
The SURMOUNT-5 post hoc analysis reported similar treatment completion among rapid and non-rapid responders.12 It also reported numerically more gastrointestinal or hepatobiliary events among rapid responders.12 “Numerically more” describes the observed counts; it does not prove a causal difference.12
Responder groups can differ for reasons beyond the assigned comparison.7 They are formed according to what happened after enrollment, including the amount of weight change.7 Safety findings across those later-created groups are therefore descriptive and require caution.12
The useful reading habit is simple: keep benefit measures, safety observations, and continuation measures separate.12 Then check whether each came from a randomized comparison, subgroup, post hoc analysis, or observational cohort.7 Those designs support different strengths of conclusion.8
Tirzepatide is named here only to introduce the following neutral catalog reference.
A practical reading checklist
First, identify whether the headline number is a mean change or a responder proportion.2 Second, note whether it uses kilograms, percent, or percentage points.1 Third, record the exact endpoint, because week 24 and week 72 are not interchangeable.3
Next, match the number to its population.9 A diabetes trial, an adults-without-diabetes trial, a geographic subgroup, and a routine-care cohort answer different questions.9 Then compare the randomized starting sample with those measured, followed, and still on assigned treatment.4
Finally, check the analysis type.8 Randomized comparisons preserve the original assignment, while post hoc responder groups reorganize participants by later outcomes.7 Observational matching can reduce measured differences, but it cannot establish causation as randomization can.8 This checklist turns one impressive percentage into a result with boundaries.2
Bottom line
No single obesity-trial percentage tells the whole story.2 Mean percent change summarizes the group, while responder rates count people crossing selected thresholds.5 Both depend on the population, endpoint, and analysis.3 Completion, treatment continuation, and an available measurement are separate pieces of evidence.4
For Filipino readers, the fairest comparison starts by matching like with like.9 Compare the same outcome, deadline, population, and research design.3 Treat post hoc groups, subgroups, and observational cohorts as their stated contexts allow.7 The goal is not to dismiss a strong number. It is to understand exactly whom that number describes.11
This article is educational research context, not medical advice. Catalog links are neutral references and do not imply a treatment or human-use recommendation.
Frequently asked questions
Is percent weight loss the same as kilograms lost?
No. Kilograms give the absolute scale change, while percent change relates that change to baseline weight.1 The same kilogram reduction can represent different percentages for people with different starting weights.1 Percentages therefore help compare relative change across different baselines.1 The baseline is the denominator that gives the percentage meaning.1
What does “mean percent weight change” tell me?
It tells you the arithmetic average change for the analyzed group.2 It does not reveal the full spread of individual results.2 Read it beside responder proportions, uncertainty, and the number of participants represented at the endpoint.5 The average and responder proportion answer related but distinct questions.2
What counts as a responder?
Whatever the study prespecified or defined for that analysis.5 One analysis used at least 15% by week 24 for “rapid” response.7 Another used at least 15% during year one for “high” response.3 Always check the threshold and deadline. Similar labels can therefore classify outcomes over different periods.3
Are trial completers the same as people still on treatment?
Not necessarily. REIMAGINE 2 reported 95.7% study completion, while 87.6% remained on assigned treatment at week 68.4 A person may continue follow-up after stopping assigned treatment.4 The two percentages answer different questions. Reporting both prevents those participation states from being merged.4
Why do later sample sizes matter?
Later results may represent fewer people than the starting group.10 In one observational cohort, counts fell from 143 at week 12 to 113 at week 24.10 Without reasons for that change, readers cannot assume the later group represents everyone initially observed.10 The study abstract did not explain every reason for the smaller later group.10
Can I compare percentages from different trials directly?
Only cautiously. Trials may differ in participants, endpoints, comparison groups, and analysis methods.3 A Japanese-criteria subgroup should not automatically represent a full global trial or Filipino readers.9 Match the design and context before comparing the numbers. Observational matching also cannot establish causation in the same way as randomization.8
Sources
Footnotes
-
Weight Loss in Veterans with Schizophrenia and Multimorbidity Prescribed Semaglutide: Results From a National Retrospective Cohort Study.; Weight Changes With Lower Doses of Semaglutide in Clinical Practice: Findings From the Chinese HARMONY Cohort.. Retrospective US Veterans cohort and observational Chinese routine-care cohort reporting both relative and absolute weight change. The same kilogram change represents different percentages for people with different starting weights. ↩ ↩2 ↩3 ↩4 ↩5 ↩6 ↩7 ↩8 ↩9 ↩10 ↩11 ↩12
-
Weight-loss dynamics with tirzepatide versus semaglutide.; Weight Changes With Lower Doses of Semaglutide in Clinical Practice: Findings From the Chinese HARMONY Cohort.. Large propensity-matched retrospective cohort and smaller observational Chinese cohort reporting means alongside responder categories or thresholds. Means can conceal wide variation and should be read with responder proportions and uncertainty. ↩ ↩2 ↩3 ↩4 ↩5 ↩6 ↩7 ↩8 ↩9 ↩10 ↩11 ↩12
-
Weight-loss dynamics with tirzepatide versus semaglutide.; Relationship of early rapid weight loss to efficacy and safety of tirzepatide and semaglutide for obesity: SURMOUNT-5 post hoc analysis.. Post hoc analysis of a randomized phase III trial and a retrospective propensity-matched electronic-health-record cohort. Similar labels can represent different deadlines, populations, and analytic methods. ↩ ↩2 ↩3 ↩4 ↩5 ↩6 ↩7 ↩8 ↩9 ↩10 ↩11 ↩12
-
Cagrilintide-semaglutide (CagriSema) versus semaglutide or cagrilintide in people with type 2 diabetes (REIMAGINE 2): a double-blind, randomised, controlled, phase 3 study.. Phase III randomized, double-blind trial in adults with type 2 diabetes and overweight or obesity. Study completion and remaining on assigned treatment are distinct measures and should not be merged. ↩ ↩2 ↩3 ↩4 ↩5 ↩6 ↩7 ↩8 ↩9 ↩10 ↩11 ↩12 ↩13
-
Relationship of early rapid weight loss to efficacy and safety of tirzepatide and semaglutide for obesity: SURMOUNT-5 post hoc analysis.; Coadministered Cagrilintide and Semaglutide in Adults with Overweight or Obesity.. Phase III randomized obesity trials and a post hoc randomized-trial analysis using thresholds at weeks 24, 68, and 72. Thresholds and timepoints differ across analyses, so responder percentages are not automatically comparable. ↩ ↩2 ↩3 ↩4 ↩5 ↩6 ↩7 ↩8 ↩9 ↩10
-
Coadministered Cagrilintide and Semaglutide in Adults with Overweight or Obesity.. Phase III randomized, double-blind trial in adults without diabetes who had overweight with a related condition or obesity; all groups also received lifestyle intervention. These results apply to the studied combination, population, estimand, and 68-week period. ↩ ↩2 ↩3 ↩4 ↩5 ↩6 ↩7
-
Relationship of early rapid weight loss to efficacy and safety of tirzepatide and semaglutide for obesity: SURMOUNT-5 post hoc analysis.. Post hoc subgroup analysis of the randomized phase III SURMOUNT-5 obesity trial, defining rapid response as at least 15% weight reduction by week 24. Post hoc responder groups were defined after randomization and should not be treated as a separate randomized comparison. ↩ ↩2 ↩3 ↩4 ↩5 ↩6 ↩7 ↩8 ↩9 ↩10 ↩11
-
Weight-loss dynamics with tirzepatide versus semaglutide.. US real-world electronic-health-record analysis with 10,339 matched patients in each treatment cohort. This observational result used maximum recorded loss and cannot establish causation like a randomized trial. ↩ ↩2 ↩3 ↩4 ↩5 ↩6
-
Tirzepatide compared with semaglutide in obesity disease: a subpopulation analysis applying Japan Society for the Study of Obesity criteria in the global SURMOUNT-5 trial.. Prespecified or reported subpopulation analysis of 383 participants from the global randomized SURMOUNT-5 trial who met Japanese obesity-disease criteria. Subgroup findings may not generalize to the full trial population or Filipino readers. ↩ ↩2 ↩3 ↩4 ↩5 ↩6 ↩7 ↩8
-
Weight Changes With Lower Doses of Semaglutide in Clinical Practice: Findings From the Chinese HARMONY Cohort.. Observational HARMONY cohort of Chinese adults with obesity receiving semaglutide alongside lifestyle counselling. The abstract does not explain every reason for the smaller later sample, and the result is not randomized. ↩ ↩2 ↩3 ↩4 ↩5 ↩6 ↩7 ↩8
-
Diabetic Status, Advanced Age, and Hispanic Ethnicity Predict Poorer Weight Loss in Patients With Obesity Receiving Semaglutide.. Single-center observational multidisciplinary obesity-clinic cohort in New York City. The 12-month outcome describes continuers, not everyone initially prescribed treatment, creating potential selection bias. ↩ ↩2 ↩3 ↩4 ↩5 ↩6 ↩7 ↩8 ↩9 ↩10
-
Relationship of early rapid weight loss to efficacy and safety of tirzepatide and semaglutide for obesity: SURMOUNT-5 post hoc analysis.. Post hoc responder analysis of a randomized phase III head-to-head obesity trial. The safety comparison was descriptive, and a numerical difference does not by itself establish a causal difference. ↩ ↩2 ↩3 ↩4 ↩5