TL;DR
- A lower scale reading cannot show how much change came from fat or fat-free mass, so body weight alone cannot settle a muscle-loss question.1
- Lean mass includes more than skeletal muscle, and a scan-derived decline does not automatically prove lost strength, poorer movement, or worse gym performance.2
- In a 160-person tirzepatide substudy, both fat mass and lean mass fell, with about three quarters of lost weight coming from fat mass.3
- Across dietary weight-reduction trials, resistance exercise protected fat-free mass and improved strength even when total weight loss was similar to diet alone.4
In Filipino gym conversations, “Did I lose muscle?” often follows a faster drop on the scale, a looser uniform, or a lift that suddenly feels heavy. The question matters whether training happens in a condominium gym, a barangay court, or between long commutes. Yet the answer needs more than a mirror and one weigh-in. Research separates body weight, lean mass, skeletal muscle, strength, and daily function because each tells a different part of the story.2
Start with what the scale cannot tell you
A bathroom scale reports total body weight, not the material that changed.1 Two people can lose the same number of kilograms while losing different amounts of fat and fat-free mass.1 Body mass index has the same basic limit because it is calculated from weight and height.1
Body composition adds another view by estimating how weight is divided into compartments.5 This is why a progress check based only on the scale can answer “how much,” but not “what kind.”1 A gym log may add waist measurements or strength trends, yet those are still separate signals rather than a single muscle diagnosis.6 The useful first question is therefore not whether any lean mass changed, but what the study or device actually measured.6
Tirzepatide is named only to introduce the following neutral catalog reference.7
Lean mass is not a synonym for muscle
Research papers often use “lean mass,” “fat-free mass,” and “skeletal muscle” close together, but the terms are not interchangeable.2 Fat-free mass includes water, protein, minerals, organs, and other non-fat material.2 Lean values from a body scan can therefore move for reasons that are not identical to losing contractile muscle tissue.2
DXA, short for dual-energy X-ray absorptiometry, estimates fat, bone mineral, and non-bone lean compartments.6 It is useful for comparing group changes under controlled conditions.6 It does not directly test how hard someone can squat, carry groceries, climb an MRT staircase, or finish a set.6
That distinction prevents two common errors.2 A lower lean-mass number should not be dismissed, but it also should not be renamed “pure muscle loss” without the right measurement.2 Mass, strength, quality, and function remain related but separate outcomes.8
What the tirzepatide substudy measured
The SURMOUNT-1 body-composition substudy followed 160 participants with DXA scans at baseline and week 72.7 Researchers pooled 124 participants from tirzepatide groups and compared them with 36 receiving placebo.7 The substudy represented a small slice of the 2,539-person parent trial, and 73% of its participants were women.7
At week 72, average body weight changed by -21.3% in the pooled tirzepatide group and -5.3% with placebo.9 Fat mass changed by -33.9% and -8.2%, respectively.9 Lean mass also changed, by -10.9% and -2.6%.9
These numbers establish that the measured group-average change included both fat and lean compartments.9 They do not show that every participant followed the average.9 They also do not turn a DXA lean-mass result into a direct test of muscle strength or training performance.6
Why the 75–25 split needs context
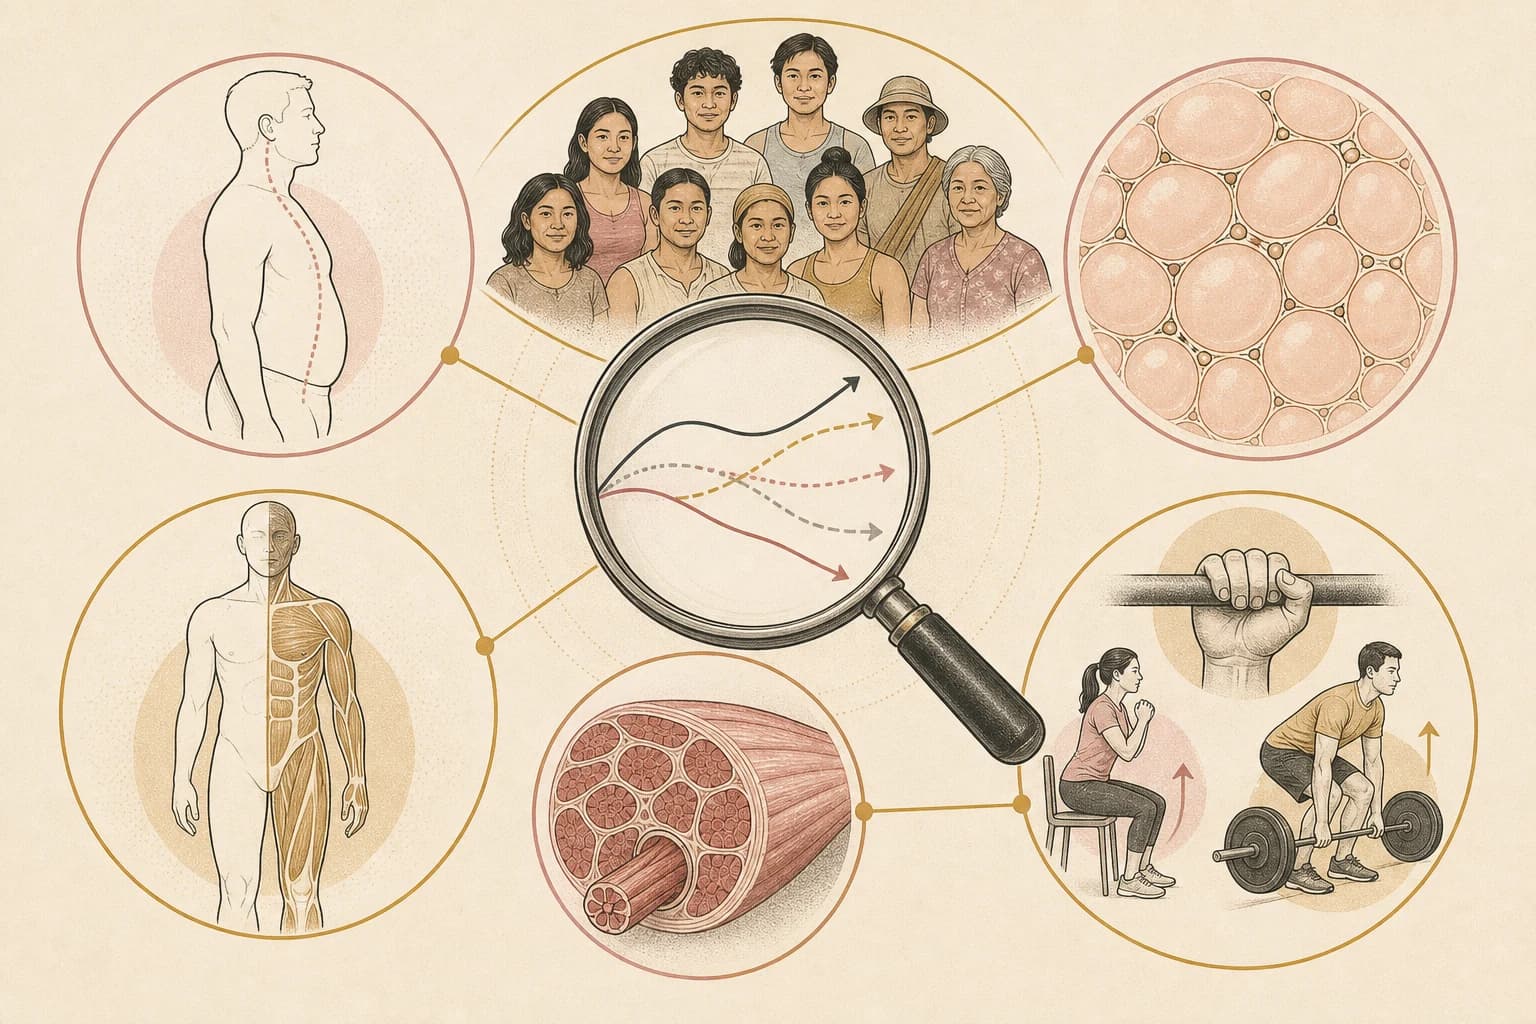
Researchers calculated that about 75% of weight lost in the substudy was fat mass and 25% was lean mass.3 The same approximate split appeared in both the pooled tirzepatide and placebo groups.3 That comparison matters because it places the proportion inside this particular trial rather than presenting it as a unique product effect.3
The fraction is descriptive, not a verdict on whether a change was harmful.3 It cannot identify how much came from skeletal muscle, water, organs, connective tissue, or the lean part of shrinking adipose tissue.2 It also cannot show whether a participant became stronger or weaker.6
A broader network meta-analysis of 22 randomized trials found a similar overall pattern across GLP-1-based agents.10 Lean mass made up about one quarter of total weight reduction, while its share of body weight remained unchanged.10 The trials differed in populations, agents, durations, and measurement methods.10
Semaglutide offers a related comparison
An exploratory STEP 1 analysis used DXA data from 140 participants at nine sites.11 Ninety-five received semaglutide and 45 received placebo, and 76% of the substudy participants were women.11 The measurements were taken at baseline and week 68.11
In the semaglutide group, average body weight changed by -15.0%, fat mass by -19.3%, and lean body mass by -9.7%.5 At the same time, lean body mass rose by 3.0 percentage points as a share of total body weight.5 Both statements can be true because an absolute compartment can shrink while becoming a larger fraction of a smaller total.5
This was an exploratory subset, not a direct measurement of muscle tissue or strength.11 Its value is comparative: it shows again why absolute kilograms, percentages, and physical performance should not be collapsed into one headline.5
Semaglutide is named only to introduce the following neutral catalog reference.11
Resistance work changes the picture
The strongest practical evidence comes from trials that measured exercise during dietary weight reduction.4 A systematic review found 25 randomized trials in adults aged 18 to 65 with overweight or obesity.4 Adding resistance exercise did not materially change total body-weight loss compared with diet alone.4
The composition and performance results did change.4 Resistance exercise attenuated the loss of fat-free mass, increased fat-mass loss, and produced better strength outcomes.4 The certainty of evidence differed by outcome, and the programs were not identical.4 The review therefore supports a general pattern, not one universal routine.4
For gym communities, this separates two scoreboards.4 Scale change can look similar while strength and body composition move differently.4 A workout record is not a scan, but consistent performance notes can show information that the scale never captures.6
Protein evidence adds a careful second layer
Food discussions in the Philippines can quickly become debates about rice, ulam, shakes, or meal timing. The research question is narrower: during weight reduction, does greater protein exposure change muscle-related outcomes?12
A meta-analysis combined 47 studies with 3,218 adults who had overweight or obesity.12 Higher protein intake was linked with better retention of muscle mass during weight reduction.12 It did not significantly protect muscle strength or physical function.12 The studies also varied in participants, interventions, protein exposure, and risk of bias.12
That result does not create one intake target for every reader.12 It shows why “more muscle mass retained” and “better strength” should not be treated as the same finding.12 A separate review likewise found that a decline in measured muscle mass during diet-induced weight reduction did not automatically mean poorer strength or overall function.8
Bottom line
The honest answer to “Will weight reduction cost me muscle?” begins with definitions.2 Scale weight cannot separate fat from fat-free mass.1 Lean mass is broader than skeletal muscle, and neither number directly measures strength.6
The tirzepatide and semaglutide substudies each recorded declines in fat and lean compartments, but both were selected DXA subsets with important limits.7 Across broader research, resistance exercise attenuated fat-free-mass loss and improved strength during dietary weight reduction.4 Higher protein exposure supported muscle-mass retention without clearly protecting strength or function.12 For a Filipino reader comparing weigh-ins, waist changes, and gym performance, the best interpretation uses several signals and keeps each one in its proper lane.6
This article is educational research context, not medical advice. Catalog links are neutral references and do not imply a treatment or human-use recommendation.
Frequently asked questions
Does losing lean mass always mean losing skeletal muscle?
No. Lean mass and fat-free mass include water, organs, minerals, connective tissue, and other non-fat material alongside skeletal muscle.2 A decline can include muscle, but the reported compartment does not reveal pure contractile-tissue change by itself.2 The measurement name and method must stay attached to the result.6
Can a bathroom scale show whether I lost muscle?
A scale shows total body weight and cannot divide a change into fat and fat-free compartments.1 It can track a weight trend, but it cannot identify the tissue behind that trend.1 Body-composition methods add estimates, while strength and function require their own measures.6
What did the tirzepatide body-composition study find?
In the 160-person SURMOUNT-1 substudy, average fat mass and lean mass both fell over 72 weeks.9 About 75% of weight lost was fat mass and 25% was lean mass in both pooled tirzepatide and placebo groups.3 The subset was small and did not directly test muscle strength.7
Did the semaglutide analysis show the same pattern?
The 140-person exploratory STEP 1 analysis recorded lower body weight, fat mass, and lean body mass in the semaglutide group at week 68.5 Lean body mass still became a larger share of total weight.5 The selected subset did not directly measure skeletal muscle tissue, strength, or function.11
Why can lean mass fall while its percentage rises?
Percentages describe a part relative to the whole.5 If fat mass falls faster than lean mass, the absolute lean amount can decline while its share of the smaller body total increases.5 The STEP 1 exploratory results illustrate this arithmetic, but they do not convert the percentage into a strength measure.6
What do resistance exercise and protein studies add?
Across dietary weight-reduction trials, resistance exercise attenuated fat-free-mass loss and improved strength without materially changing total weight loss.4 Higher protein exposure supported muscle-mass retention in another meta-analysis, but did not significantly protect strength or physical function.12 Neither synthesis defines one universal plan for every person.4
Sources
Footnotes
-
The Utility of Body Composition Assessment in Nutrition and Clinical Practice: An Overview of Current Methodology. Narrative methods review of common body-composition assessment tools. More detailed methods also estimate compartments and have their own practical and technical limits. ↩ ↩2 ↩3 ↩4 ↩5 ↩6 ↩7 ↩8
-
Fundamental Body Composition Principles Provide Context for Fat-Free and Skeletal Muscle Loss With GLP-1 RA Treatments. Body-composition framework applied to weight reduction and GLP-1 receptor agonist research. The exact meaning depends on the measurement method and how a study defines its reported compartment. ↩ ↩2 ↩3 ↩4 ↩5 ↩6 ↩7 ↩8 ↩9 ↩10 ↩11
-
Body composition changes during weight reduction with tirzepatide in the SURMOUNT-1 study of adults with obesity or overweight. Proportional analysis of weight reduction in the SURMOUNT-1 DXA substudy. A percentage of group weight loss does not identify which lean tissues changed or whether strength changed. ↩ ↩2 ↩3 ↩4 ↩5 ↩6
-
Effect of resistance exercise on body composition, muscle strength and cardiometabolic health during dietary weight loss in people living with overweight or obesity: a systematic review and meta-analysis. Systematic review and meta-analysis of adults aged 18 to 65 with overweight or obesity. Certainty differed across outcomes, programs varied, and the analysis did not test one universal training plan. ↩ ↩2 ↩3 ↩4 ↩5 ↩6 ↩7 ↩8 ↩9 ↩10 ↩11 ↩12 ↩13
-
Impact of Semaglutide on Body Composition in Adults With Overweight or Obesity: Exploratory Analysis of the STEP 1 Study. Week-68 DXA findings from the 140-person exploratory STEP 1 analysis. The analysis did not turn lean body mass into a direct measure of skeletal muscle tissue, strength, or function. ↩ ↩2 ↩3 ↩4 ↩5 ↩6 ↩7 ↩8 ↩9
-
Fundamental Body Composition Principles Provide Context for Fat-Free and Skeletal Muscle Loss With GLP-1 RA Treatments; The Utility of Body Composition Assessment in Nutrition and Clinical Practice: An Overview of Current Methodology. Reviews of body-composition terminology and assessment methods. DXA remains useful for tracking body compartments when its measurement limits are kept clear. ↩ ↩2 ↩3 ↩4 ↩5 ↩6 ↩7 ↩8 ↩9 ↩10 ↩11 ↩12 ↩13
-
Body composition changes during weight reduction with tirzepatide in the SURMOUNT-1 study of adults with obesity or overweight. DXA substudy within a larger randomized trial of adults with obesity or overweight. The substudy was a small subset of the 2,539-person parent trial, pooled tirzepatide groups, and was 73% female. ↩ ↩2 ↩3 ↩4 ↩5 ↩6
-
Preserving Healthy Muscle during Weight Loss. Narrative review separating muscle mass, strength, and physical function across weight-reduction studies. Responses differ by person and setting, so mass, strength, and function should not be treated as interchangeable outcomes. ↩ ↩2
-
Body composition changes during weight reduction with tirzepatide in the SURMOUNT-1 study of adults with obesity or overweight. DXA measurements in the 160-person SURMOUNT-1 body-composition substudy. These are group averages from a substudy and do not predict an individual result or directly measure muscle strength. ↩ ↩2 ↩3 ↩4 ↩5 ↩6
-
Effect of glucagon-like peptide-1 receptor agonists and co-agonists on body composition: Systematic review and network meta-analysis. Network meta-analysis covering GLP-1 receptor agonists and dual agonists in adults with diabetes and/or overweight or obesity. The synthesis combined different populations, agents, comparators, durations, and body-composition methods. ↩ ↩2 ↩3
-
Impact of Semaglutide on Body Composition in Adults With Overweight or Obesity: Exploratory Analysis of the STEP 1 Study. Exploratory DXA substudy of adults with overweight or obesity without diabetes. This was a small, selected subset of the larger trial, and 76% of included participants were female. ↩ ↩2 ↩3 ↩4 ↩5 ↩6
-
Enhanced protein intake on maintaining muscle mass, strength, and physical function in adults with overweight/obesity: A systematic review and meta-analysis. Systematic review and meta-analysis of 3,218 adults with overweight or obesity. Studies varied in protein exposure, participant characteristics, interventions, and risk of bias; the finding is not an individual intake prescription. ↩ ↩2 ↩3 ↩4 ↩5 ↩6 ↩7 ↩8 ↩9