TL;DR
- BMI is weight divided by height squared, and the international adult cutoffs label 25 as overweight and 30 as obesity.1
- WHO kept those international categories but proposed extra Asian public-health action points, beginning at 23, because risk can appear below 25.2
- “Asian” is not one body type: studies report differences both from European comparison groups and among Asian populations themselves.3
- For a fuller view, BMI can be read beside waist measures, medical history, examination findings, health habits, and relevant laboratory results.4
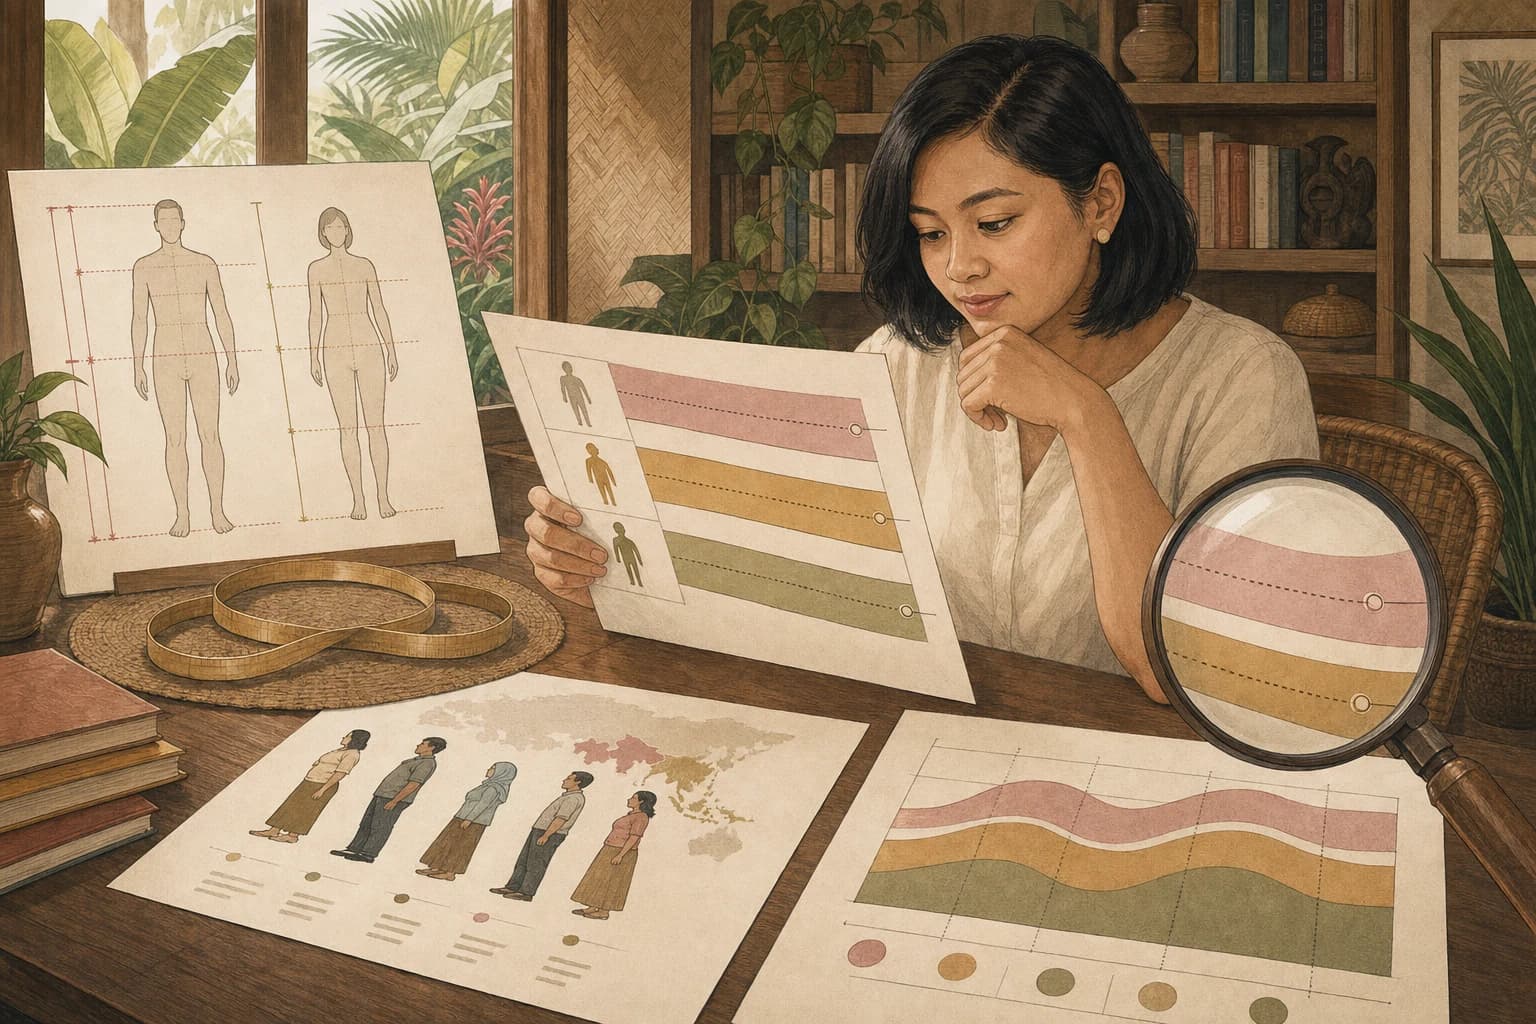
For Filipino readers, BMI often arrives as a single number on a clinic slip, fitness app, or online calculator. The arithmetic is simple; the meaning is not. A cutoff can help organize public-health work, yet it cannot tell one person’s whole story. The useful question is not whether BMI is “good” or “bad.” It is what the number measures, which threshold is being used, and what other context belongs beside it.
That wider reading makes room for useful numbers without reducing anyone to a category.
Start with what BMI can measure
BMI divides weight in kilograms by height in metres squared.1 For example, 65 kilograms divided by 1.65 metres squared gives about 23.9.1 Under the international adult scale, 25 marks overweight and 30 marks obesity.1
That neat result is a screening number, not a body scan.5 It cannot separate fat from muscle and bone.5 It also cannot show where fat sits in the body.5 Two people can therefore share a BMI while having different body composition.5
Think of BMI as a first page, not the full file. Its value is speed, low cost, and a common language for comparing groups.5 Its limit is that the same number can carry different context across bodies and populations.6
For readers looking for the exact topic, semaglutide is a neutral catalog reference.
Why the number 25 can miss earlier risk
The international cutoff of 25 was not built as a biological switch.2 Risk does not suddenly appear when a calculator moves from 24.9 to 25.0.2 Instead, BMI sits on a continuum where concern may rise gradually.2
That distinction mattered in the WHO review of Asian populations. The consultation found substantial diabetes and cardiovascular risk below BMI 25.6 Across the populations reviewed, observed-risk thresholds ranged from 22 to 25.7 High-risk thresholds ranged from 26 to 31.7
Picture two adults with BMI 24. One international table places both below its overweight line.1 The Asian evidence says that placement should not automatically close the conversation.6 It is a reason to look at population context and other risk information, not a reason to attach shame or certainty to either person.
One scale can have more than one action point
WHO did not replace the international categories with a single “Asian BMI scale.”2 It kept the international classification, then identified 23.0, 27.5, 32.5, and 37.5 as added public-health action points.2 Countries could use those points when choosing responses for their own populations.2
The wording matters. An action point is a prompt for attention, planning, or further assessment.2 It is not a verdict on appearance, discipline, or worth. It is also not a universal forecast for every person whose BMI crosses it.2
This two-layer approach solves a practical problem. International categories preserve a shared reporting language.2 Extra action points make room for risk that may emerge earlier in some populations.6 Reading both layers is more accurate than insisting that only one line can be valid.
“Asian” is a region, not one body type
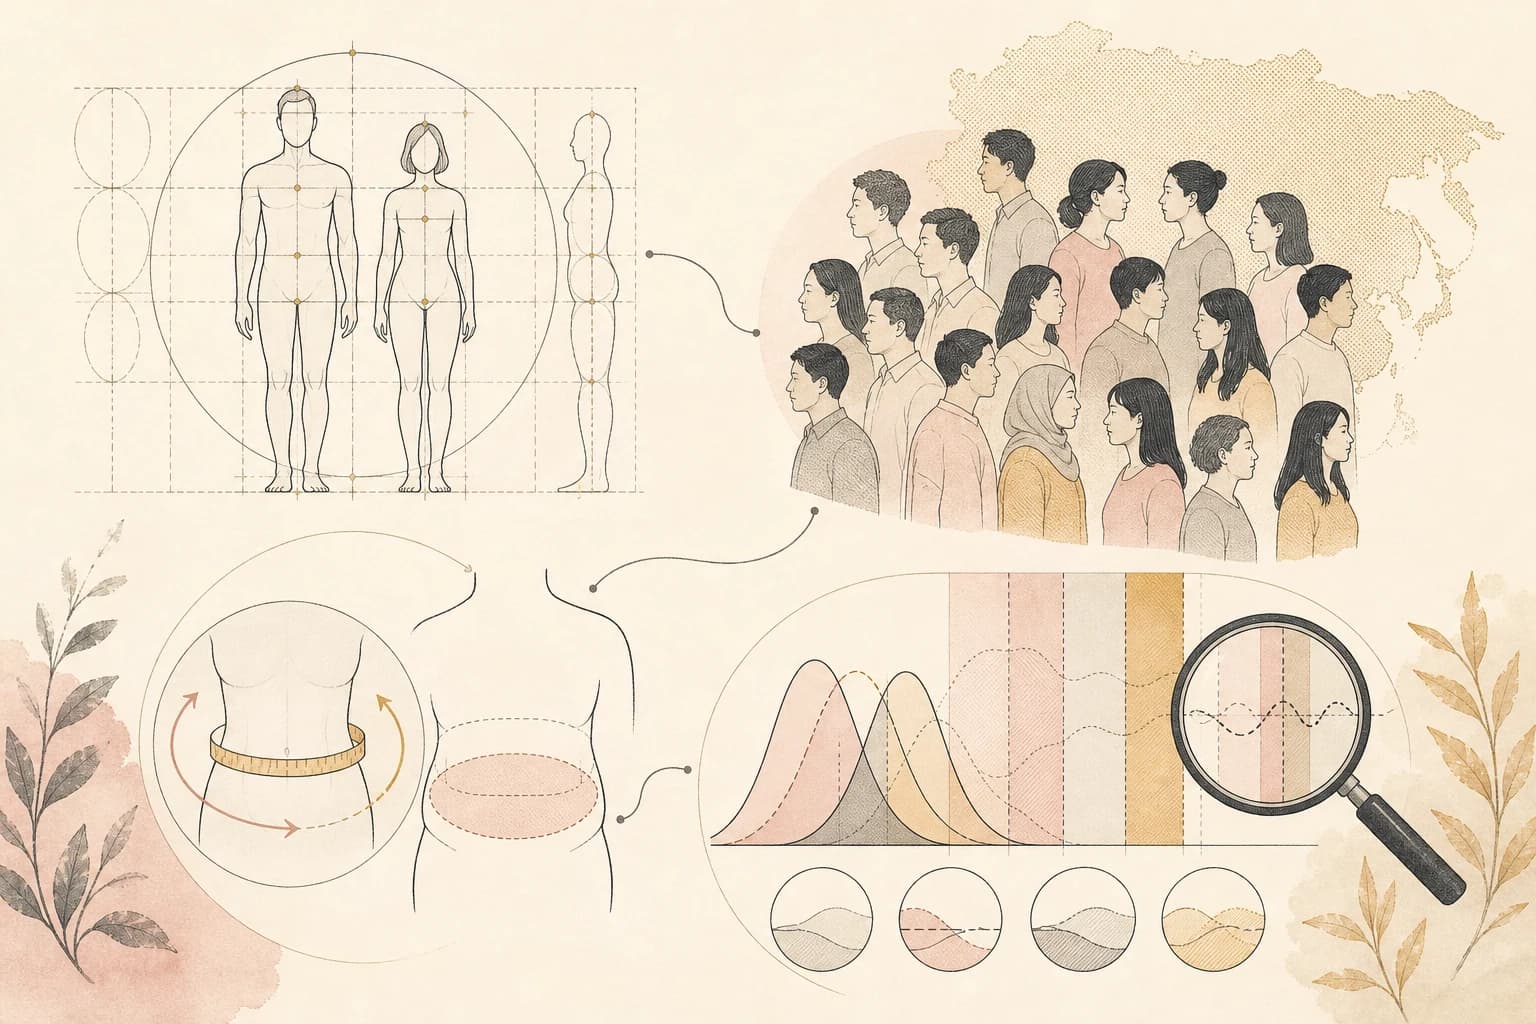
Lower action points can become misleading if “Asian” is treated as one uniform biological group. A literature overview included Chinese, Malay, Indian, and Indonesian population groups from several settings.8 At the same BMI, their body-fat percentage was generally 3–5 points higher than in Caucasian comparisons.8
But the paper’s title made a second point: Asian groups also differed from one another.3 Body build and muscularity were possible partial explanations for variation.3 Those factors do not sort neatly by passport, surname, or appearance.
For a Filipino reader, this is the guardrail. Regional evidence can explain why BMI 25 may be too blunt as the only alert.6 It cannot assign every Filipino the same body-fat percentage or personal risk.8 “Asian context” should widen the questions being asked, not replace one stereotype with another.
Large cohorts show why thresholds can move
A large English cohort offers a concrete example of risk-equivalent cutoffs. It followed 1,472,819 adults without type 2 diabetes at baseline.9 Researchers asked which BMI in each broad ethnic group matched the diabetes incidence linked to BMI 30 in White participants.9
The estimate was BMI 23.9 for South Asian participants and 26.9 for Chinese participants.9 The distance between those figures shows why a universal ethnic adjustment can hide important variation.9
These numbers do not create a Filipino cutoff. The study used health records from England and collapsed self-reported ethnicity into broad categories.9 It also examined one outcome: type 2 diabetes incidence.9 Its best lesson is about method. A threshold depends on the population, outcome, comparison group, and purpose used to derive it.9
Waist measures answer a different question
BMI summarizes weight relative to height.1 Waist circumference asks about size around the abdomen, so it adds a different kind of information.10 WHO’s waist consultation examined how waist measures relate to BMI and disease risk.10 It also highlighted variation by sex, age, ethnicity, and measurement method.10
A European cohort of 25,244 adults shows why the extra angle can matter.11 In that study, waist circumference had a stronger link with diabetes risk among people with lower BMI.11 The result came from adults in Germany, not an Asian or Philippine sample.11
So a tape measure does not erase BMI, and BMI does not make a tape measure pointless. Each captures a different signal.10 The responsible reading keeps the study population and measurement method attached to any cutoff.10
For readers comparing nearby catalog topics, tirzepatide is a neutral catalog reference.
Cebu research makes the context tangible
Philippine research shows what a wider measurement frame can look like without inventing a national rule. A Cebu longitudinal study followed about 2,000 women from 1998 to 2015.12 It tracked BMI above 25 and waist circumference above 80 centimetres as separate measures.12 It also tracked elevated blood pressure and type 2 diabetes.12
The design is useful here because it did not ask one number to represent every metabolic signal.12 BMI and waist were kept distinct, then examined beside other measured outcomes.12
Its boundary is equally important. The participants were women in a Cebu cohort, not a national sample of all Filipino adults.12 The study therefore cannot supply one cutoff for every reader in the Philippines.12 It does show why local research should preserve several measures and state exactly who was studied.
Bottom line
BMI is useful because it is quick, inexpensive, and easy to compare.5 Its international adult cutoffs still provide a common reporting scale.2 Yet WHO’s Asian review found meaningful risk below 25 and proposed added action points starting at 23.6 Those points should open a wider assessment, not produce a personal verdict.2
For Filipino readers, the most careful approach is layered. Read the BMI number, the threshold system, and the population behind that system. Then place the result beside waist measures and other relevant health information.4 Keep age in view, too, because adult cutoffs do not apply directly to children or adolescents.13
This article is educational research context, not medical advice. Catalog links are neutral references and do not imply a treatment or human-use recommendation.
Frequently asked questions
Is BMI 23 automatically “overweight” for every Asian adult?
No. WHO retained 25 as the international adult overweight cutoff and described 23 as an added public-health action point.2 The point can trigger closer attention without becoming a universal label. The consultation also found that risk thresholds varied across the Asian populations it reviewed.7
Why not simply replace 25 with 23 in the Philippines?
One swap would suggest a precision the regional evidence does not provide.7 WHO found different observed-risk and high-risk ranges across Asian populations.7 It proposed ways for countries to choose action points for their own populations, while retaining international categories for shared reporting.2
Can BMI tell me how much body fat I have?
Not directly. BMI uses only weight and height, so it cannot separate fat from muscle and bone.5 It also cannot show where fat is stored.5 Direct body-composition methods answer different questions, while BMI remains useful as a quick screening measure.5
Why measure the waist if BMI is already known?
Waist size adds information about the abdomen that BMI does not capture.10 In one European cohort, its association with diabetes risk was stronger among adults with lower BMI.11 That finding supports a layered reading, but it does not establish a Philippine waist cutoff.11
Does the Cebu study represent all Filipino adults?
No. The study followed about 2,000 women in a Cebu cohort and tracked BMI, waist size, blood pressure, and diabetes measures.12 Its population and setting limit national generalization. Its value here is showing how local research can keep several signals separate.12
Are adult BMI cutoffs suitable for children and teenagers?
No. WHO uses BMI-for-age for people aged 5–19, comparing the value with its age-based growth reference.13 Growth changes the meaning of the number, so adult thresholds should not be copied onto younger people. Age-specific interpretation is part of the measurement, not an optional detail.13
Sources
Footnotes
-
Obesity and overweight. Current WHO definition and international adult classification. A category is a population-level classification and does not by itself describe body composition or an individual's full health context. ↩ ↩2 ↩3 ↩4 ↩5 ↩6
-
Appropriate body-mass index for Asian populations and its implications for policy and intervention strategies. Policy recommendations from the WHO expert consultation. The action points were intended to help countries choose responses for their populations, not to create a second universal diagnostic ladder. ↩ ↩2 ↩3 ↩4 ↩5 ↩6 ↩7 ↩8 ↩9 ↩10 ↩11 ↩12 ↩13 ↩14
-
Asians are different from Caucasians and from each other in their body mass index/body fat per cent relationship. Cross-population literature overview of BMI and measured body-fat percentage. The proposed explanations are partial and do not support ranking or stereotyping ethnic groups. ↩ ↩2 ↩3
-
BMI Frequently Asked Questions. Current CDC public-health guidance on BMI as one measure within a broader assessment. The page provides general guidance and does not define a Philippine clinical process. ↩ ↩2
-
BMI Frequently Asked Questions. Current CDC explanation of adult BMI calculation and interpretation. BMI remains useful for screening, but interpretation should include other relevant information. ↩ ↩2 ↩3 ↩4 ↩5 ↩6 ↩7 ↩8 ↩9
-
Appropriate body-mass index for Asian populations and its implications for policy and intervention strategies. WHO expert review of associations among BMI, body-fat percentage, and health risk in Asian populations. The consultation did not identify one new universal cutoff for every Asian population. ↩ ↩2 ↩3 ↩4 ↩5 ↩6
-
Appropriate body-mass index for Asian populations and its implications for policy and intervention strategies. Ranges synthesized by the WHO expert consultation from population evidence available at the time. These are ranges across populations, not individual predictions or Filipino-specific thresholds. ↩ ↩2 ↩3 ↩4 ↩5
-
Asians are different from Caucasians and from each other in their body mass index/body fat per cent relationship. Literature overview including Indonesian groups of Malay and Chinese ancestry, Singaporean Chinese, Malays and Indians, and Hong Kong Chinese. The estimate summarizes the groups and methods reviewed and should not be assigned to every Asian individual. ↩ ↩2 ↩3
-
Ethnicity-specific BMI cutoffs for obesity based on type 2 diabetes risk in England: a population-based cohort study. Population-based electronic-health-record cohort in England with participants grouped by self-reported ethnicity. The estimates concern one outcome and broad groups in England; they do not establish a Filipino cutoff or predict an individual's risk. ↩ ↩2 ↩3 ↩4 ↩5 ↩6 ↩7
-
Waist circumference and waist-hip ratio: report of a WHO expert consultation. WHO expert consultation on measurement methods and prediction of cardiovascular disease, diabetes, and mortality. The report's scope does not make one waist threshold universal for every population. ↩ ↩2 ↩3 ↩4 ↩5 ↩6
-
Body mass index, waist circumference, and the risk of type 2 diabetes mellitus: implications for routine clinical practice. European prospective cohort of adults aged 35–65 with a mean follow-up of eight years. This European cohort supports using waist information alongside BMI but does not set an Asian or Philippine threshold. ↩ ↩2 ↩3 ↩4 ↩5
-
Seventeen-Year Changes in Body Mass Index, Waist Circumference, Elevated Blood Pressure, and Diabetes Phenotypes in a Cohort of Filipino Women. Cebu Longitudinal Health and Nutrition Survey cohort of Filipino women. The study population was women from Cebu, so its design and findings should not be generalized to all Filipino adults. ↩ ↩2 ↩3 ↩4 ↩5 ↩6 ↩7 ↩8 ↩9
-
Obesity and overweight. Current WHO definitions for children and adolescents aged 5–19. Adult BMI thresholds should not be directly applied to children or adolescents. ↩ ↩2 ↩3